Is the world getting greener?
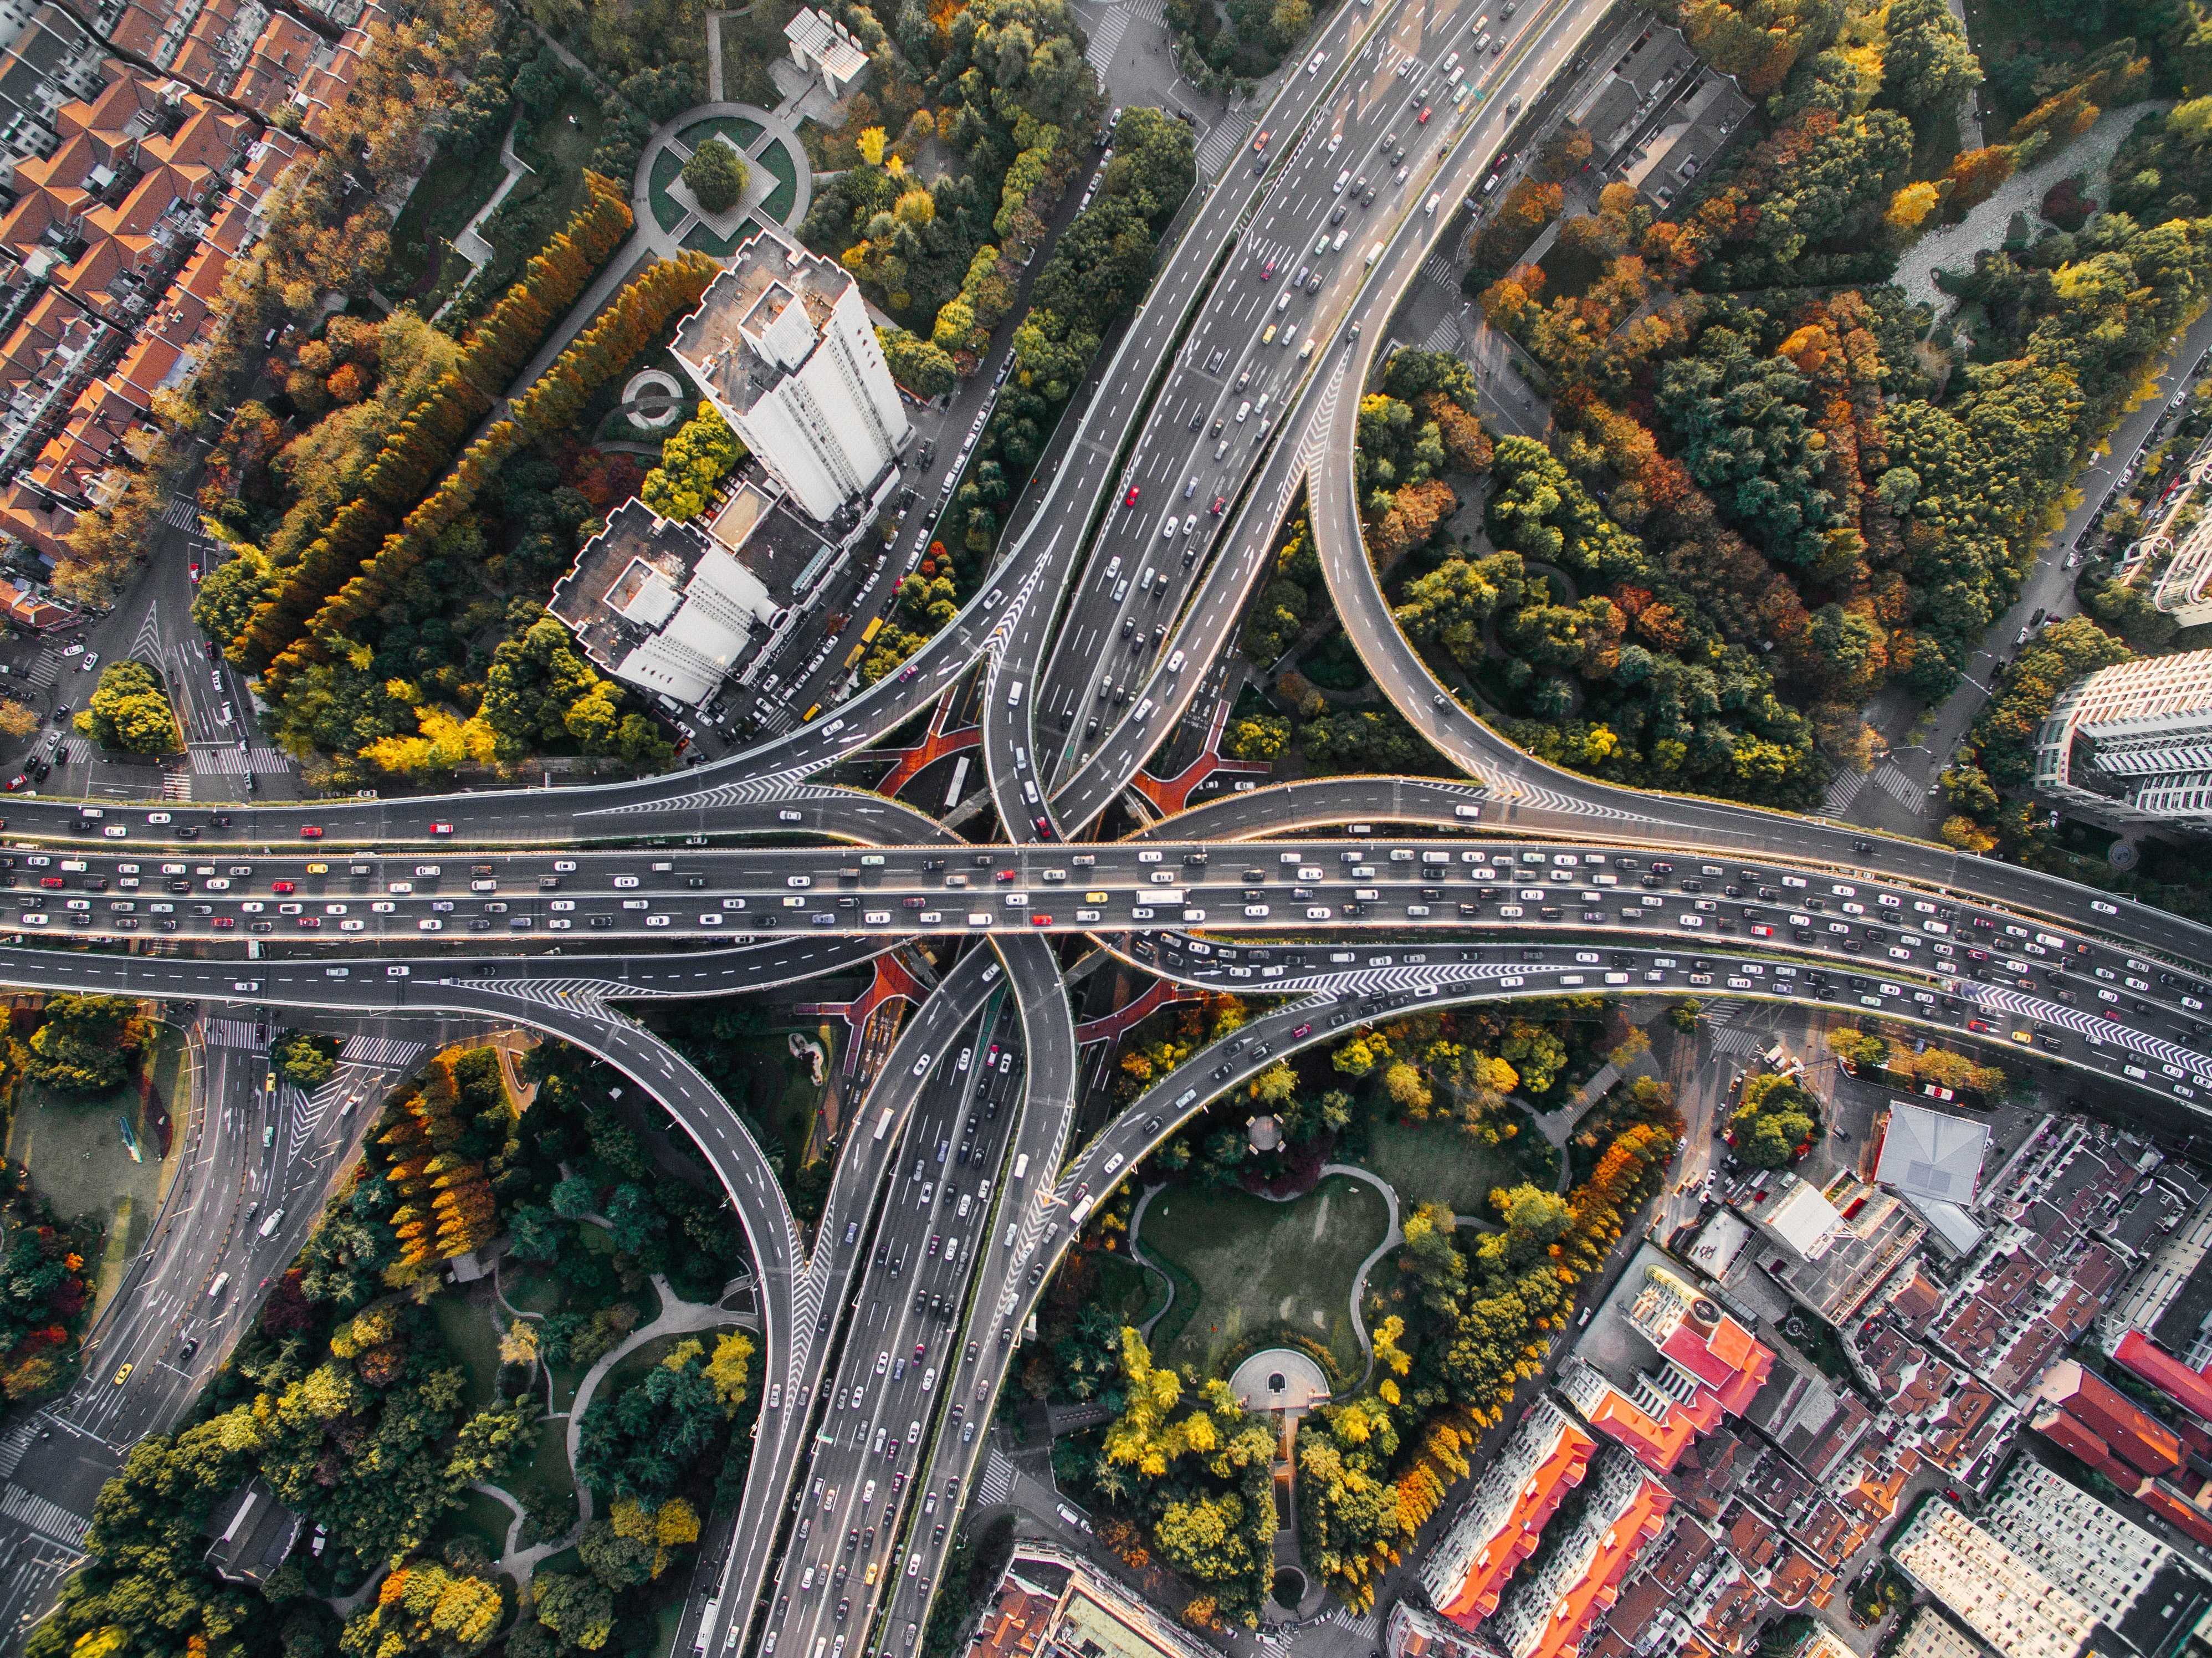
Through the passage of time all cities change. These changes can be negative, positive or neutral depending on the viewpoint. The result is often derived from both deliberate actions from city development and the impact of specific weather conditions. On a global average there has been a slight decline in urban greenspace, -0.01% less vegetation in 2019 compared to 2018. Extensive city developments in Central East Asia (China) accounts for most of the decline (-52km2). However, a strong positive development in Europe and North America (+38km2) helps to offset that on the global scale.
We wanted to find out
When we first started developing HUGSI we had two main questions that we wanted to answer; How green are the cities of the world? Are they getting greener? These are our north stars, that drive us to continue our efforts and the expansion of the HUGSI report. We have updated the report to include detailed Change analysis. To produce this new data set, we have analyzed the land use within the HUGSI-boundaries.
A new layer of information
Adding a new layer to the HUGSI data, all cities were divided into multiple 250x250 m hexagon shapes. By applying learning models to the material, we were able to define a main class to each hexagon; trees, grass, water or other (urban hard made surfaces like houses, roads etc.). When we compare this main class for the last two years, our report detects any change. From a vegetation perspective the change is either positive, negative or neutral. We have classified positive change as water or other, into trees or grass – increasing the vegetation. Negative change is, trees or grass converted into water or other – therefore, decreasing the vegetation. Neutral change has been identified as when water converts into other or vice versa – not affecting any vegetation.
Similar insights

Published undefined on
Published undefined on
Published undefined on

Published undefined on

Published undefined on
Published undefined on
Published undefined on

Published undefined on


